Reports

PTAB Discretionary Denials: In the First Half of 2020, Denials Already Exceed All of 2019

Following on Unified’s previous study, the PTAB continues their steady uptick in procedural denials under § 314 through the first half of 2020, and on procedural, non-merits-based denials in general. These § 314 denials have tied 2019’s annual total—and total denials are just 13 denials shy of 2018’s total, with just half the year reported. Projections show procedural denials will most likely greatly exceed those in 2019 by the end of Q3. Most significantly, though, the General Plastic/NHK framework is being used to procedurally deny petitions more than ever—projecting more than double the number of denials in 2019, they are set to make up roughly 30% of all denials this calendar year.

Institution Decisions.png

Thus far, 2020 has seen seventy-five § 314(a) denials, which accounts for roughly 30% of the all denials to date (268). This already ties the previous year total, which only saw 75 § 314(a) discretionary denials total. 2018 saw 45, while 2017 and 2016 saw 15 and 5, respectively.

Procedural Denials vs. All Decisions.png

Indeed, § 314(a) now accounts for the majority of procedural denials (including denials under § 325 and those related to joinder). The ratio of § 314(a) procedural denials has grown this year, as you can see below. 2019 saw 49% of all procedural denials be § 314(a) (75 out of 154); in 2020, more than 74% of procedural denials have been under § 314(a) (75 out of 102). This means that the PTAB is expected to issue 162 § 314(a) denials by the end of the year, a 116% increase from last year.

§ 314(a) Denials by Year (Total).png

This is a dramatic increase over the life of the Board, where it has denied institution on 7.0% of all petitions to date for purely procedural reasons—including denials of joinder, § 314, § 325, and other requirements. This is an increase of the previous study, based on the rapid rise of the use of such denials over the past six months.

§ 314(a) Denials.png

Of all denials to date, roughly a quarter have not been on the merits; indeed, in total 7.0% of all denials have been over § 314(a) (nearly all from the past two years); and 5.7% have been over § 325(d). Note that § 314(a) denials have exploded since 2018, particularly as a percentage of the (falling) filing numbers and institution rates. Both have increased since the last study.

§ 314(a) Denials.png
§ 325(d) Denials.png

Parallel District Court Cases Affected by Denials: Early Numbers

When looking at the petitioners that are denied on 314(a) with related parallel district court litigation, the California Northern District Court comprises 45% of the cases related to denials, with 208 cases being cited. (It should be noted that often with denials multiple cases are cited for the denial, and these numbers don’t yet distinguish between “multiple petition” denials under General Plastic, “parallel petition” denials under the July 2019 Trial Practice Guide Update, or “trial date” denials under NHK Spring and Aptiv. A large number of these suits are related to sprawling ongoing litigations, like the yearslong Finjan or Rovi v. Comcast disputes.) These numbers encompass the Board’s entire history, and are a lagging indicator of where cases were being filed years ago. 

The Texas Eastern District has 80 cases cited, comprising 17% of all 314(a) denials. The Delaware District Court had 67 cases cited, comprising 15% of all 314(a) denials. The Texas Western District Court has seen 1 case cited in 2019, and this year that number has risen to 4, accounting for 1% of all 314(a) denials to date; as that docket balloons to more than 20% of the US patent docket, that number is set to rise dramatically.

Screen Shot 2020-07-27 at 8.56.57 AM.png

Looking at the jurisdictions breakdown of § 314(a) denials, the venues as a whole average around 457 days. The top five range from 812 days (California Southern) to 435 days (Florida Southern). Interestingly, Texas Western is below the average by only 5 days, 452 respectively. 

Note that many of the cases denied under § 314(a) due to the advanced stages of a district court proceeding are litigations that were filed more than a two years ago, which is the average time of a district court in the United States to get to trial, suggesting this breakdown is a lagging indicator of where trials were filed more than two years ago. Given that the Western District of Texas has recently adopted aggressive local rules establishing early aspirational trial dates and the docket has ballooned, we have begun to see the Western District of Texas account for more cases related to denials under § 314(a). Of the recent denials of the past few months, nearly all have been due to trial dates in either the Eastern or Western Districts of Texas.

Screen Shot 2020-07-27 at 9.13.07 AM.png

Copyright © 2020, Unified Patents, LLC. All rights reserved.

2020 First-Half Transport Zone Update: Litigation Doubles

Overview

As patent litigation continues to rise, the Transport Zone is expected to see an 105% increase by the end of 2020. At the halfway point of the year (78 cases), litigation has already reached last year high (76 cases). This means that based on current numbers litigation is expected to hit  150+ cases reaching near all-time highs in this zone.

Screen Shot 2020-07-15 at 3.50.56 PM.png

Transport manufacturers continue to be the main targets of litigation. These manufacturers comprise 89% of all first-named defendants. Manufacturers are defined as companies such as Toyota, Honda, Ford, and Tesla. Dealerships are defined as a company that primarily sells for the manufacturer. These would include Kinsel Ford and Zimbrick Honda. Suppliers are companies such as Bosch Automotive, ABB, and even Uber that provide components or services.

NPEs continue to bring the majority of the lawsuits against Transport manufacturers and suppliers. NPEs are responsible for almost 77% of all transport litigation.

Looking at the year-by-year trends, NPE litigation has doubled in the first half of the year since last year in the Transport Zone.

The top-five plaintiffs in 2020, four are prolific NPEs, continually attack this zone. Those four NPEs account for 37% (29 cases out of 78) of litigation brought this year alone. The top-five plaintiffs are:

  1. JG Technologies (NPE): 11

  2. Display Technologies (NPE): 9

  3. Noco Company (Operating Company): 6

  4. Omnitek Partners (NPE): 5

  5. 2BCOM (NPE): 4

The top-five defendants in 2020, all manufacturers account for 25% of first-named defendants. The manufacturers are:

  1. Tesla: 5

  2. Ford: 5

  3. BMW: 4

  4. Hyundai: 3

  5. Jaguar Land Rover: 2


METHODOLOGY

Unified looked at all major Transport manufacturers and the top 10 Transport suppliers by revenue since 2012.

Total number of reported cases can vary. Unified made its best attempt to eliminate mistaken or duplicative filings.

Statistics include litigations initiated by NPEs or Declaratory Judgments (DJs) initiated by operating companies against NPEs.

Unified strives to accurately identify NPE through all available means, such as court filings, public documents, and product documentation.

LEGEND

Non Practicing Entity (NPE) = Company which derives the majority of its total revenue from Patent Licensing activities.

Operating Company or Op. Co. = Company which derives most of its total revenue from Product Sales or Services. Could be an SME or a large company.

NPE (Patent Assertion Entities) = Entity whose primary activity is licensing patents and acquired most of its patents from another entity

NPE (Small Company) = Entity whose original activity was providing products and services, but now is primarily focused on monetizing its own patent portfolio.

NPE (Individual) = Entity owned or controlled by an individual inventor who is primarily focused on monetizing inventions patents by that individual inventor.

Copyright © 2020, Unified Patents, LLC. All rights reserved.

Q2 2020 Developer Updates

New Portal Product and Features

Unified’s Portal PTAB docket now includes access to all the exhibits for the entire case. To view the exhibit simply click on the paper number. Users can browse through the exhibits and download them for their own use.

In addition to viewing all the exhibits, users are now able to download the entire PTAB docket for cases. 

In monitoring trends at the PTAB, Unified’s Portal now tracks specific procedural denials including 314(a) and 325(d).

Unified’s Portal also now tracks the petitioner entity type at the PTAB.

OPEN HEVC and AVC now includes improved analytics to understand the HEVC/H.265 & AVC/H.264 landscape.

Copyright © 2020, Unified Patents, LLC. All rights reserved.

Unified’s Patent Quality Initiative (PQI) Releases Economic Report Showing the AIA led to over 13,000 jobs and grew the U.S. economy by $3 billion since 2014

The Perryman Group found the PTAB has grown the U.S. economy, saved U.S. manufacturing jobs, and reduced litigation costs

Innovation is a key factor in U.S. economic growth and competitiveness—one balanced by transaction costs and freedom-to-operate. One critical element of the infrastructure facilitating product development and commercialization—the patent system—protects and allows profit from intellectual property and encourages its widespread adoption and implementation through well-calibrated patent scope.  That system includes the Leahy–Smith America Invents Act (AIA), which rechristened the Patent Trial and Appeal Board (PTAB) and created the administrative post-grant review procedures in wide use today. 

In a recent study, The Perryman Group (TPG), a world-renowned group of economists widely used and respected by industry and government, measured the effect of the AIA and PTAB on the U.S. economy. TPG found the AIA and PTAB substantially reduced patent litigation and transaction costs while generating billions in economic benefit.  The biggest gains were in manufacturing and trade, transportation, and utilities.  In short, the legislation saved U.S. jobs and has helped drive substantial economic gains over the past decade. 

TPG, using well-established economic analyses, first estimated the direct cost savings associated with reduced litigation, and then computed the total economic benefits of the associated efficiency gains as they have rippled through the economy.

Screen Shot 2020-06-23 at 3.38.29 PM.png

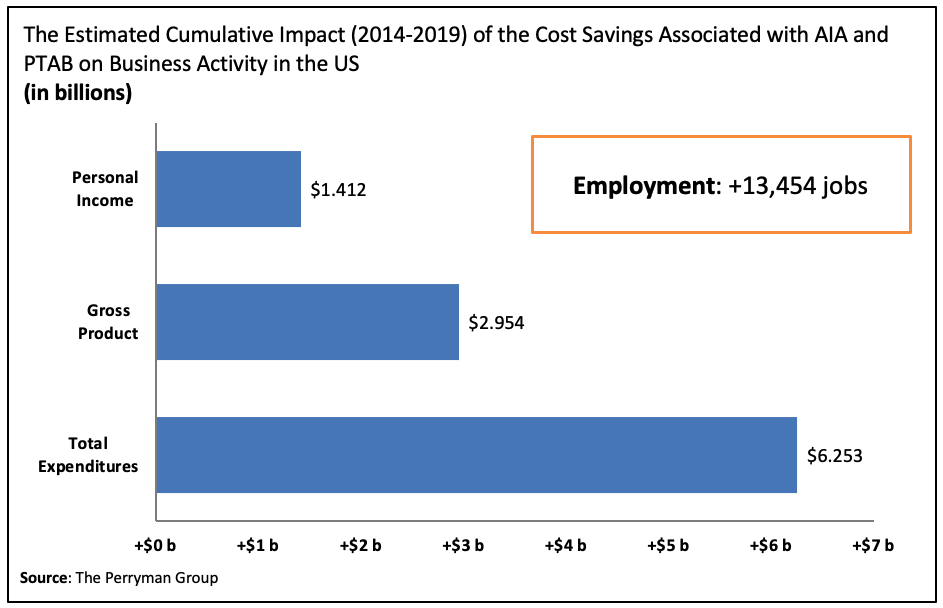
TPG estimates that over the 2014-19 period, cost savings associated with the PTAB led to an increase in U.S. business activity of $2.95 billion in gross product, $1.41 billion in personal income, and nearly 13,500 job-years of employment. With about 10,085 AIA/PTAB petitions filed over the 2014-19 period, the estimated economic benefit averaged over $292,900 per case in U.S. gross product and $139,985 in personal income.

Screen Shot 2020-06-23 at 2.59.15 PM.png

Economic performance in the United States over the long term is tied in large part to innovation and freedom-to-operate; this study demonstrates that the AIA and PTAB has not only supported innovation and reduced the patent tax on U.S. manufacturers, but has also generated substantial economic benefits across all sectors of the U.S. economy.  

The Perryman Report is part of Unified Patents’ Patent Quality Initiative (PQI), an effort to gather and provide objective data and research demonstrating how lowering patent quality will inevitably lead to even higher cost and risk for U.S. SMEs, inventors, and manufacturers, and can lead to less innovation, fewer U.S. jobs, and a drain on the U.S. economy.  Our PQI aims to provide data, studies, and testimonials to give policymakers and practitioners a clear picture of the state of the patent system.  More information about our PQI efforts can be found here.

For far greater detail, read the entire report HERE.

Copyright © 2020, Unified Patents, LLC. All rights reserved.